
When Power BI Isn’t Enough:
Knowing When to Expand Your Architecture
Power BI delivers strong value for reporting, but growing data complexity exposes its limits. As organizations scale, challenges around latency,
data sprawl, and advanced analytics require a shift beyond BI into a more robust data architecture.
Power BI has earned its position as the dominant self-service BI tool in the Microsoft ecosystem for good reason. Its familiar interface, tight Azure integration, and competitive licensing make it the default starting point for hundreds of thousands of organizations. For teams that need interactive dashboards, operational reporting, and self-service analytics on structured data, it delivers genuine value.
But there is a version of success that creates its own problems.
As organizations grow, accumulating more data sources, more users, and more operational complexity, some find that the tool they deployed three years ago is now a constraint rather than an enabler. Refresh schedules don’t cut it for time-sensitive decisions. Dataset size limits force compromises on data granularity. Requests for predictive outputs hit a wall. Reports run slowly because six teams are querying the same unoptimized semantic model simultaneously.
The question is not whether Power BI is good. It is. The question is whether your architecture has outgrown it, and how to distinguish a configuration problem from a structural one.
Understanding the Ceiling
Power BI was designed with a specific use case in mind: business users building dashboards against clean, structured data. Within that envelope, it performs well. Outside it, the cracks show quickly.
The Data Size Limit
The dataset size limit is the most immediate and tangible constraint. Power BI Pro caps individual semantic models at 1 GB per dataset. Moving to Premium per user or a capacity-based Premium license extends this significantly; the large model storage format available in Premium allows datasets to grow substantially beyond the Pro ceiling. But that extension comes at a licensing cost that scales with your user base. As of 2025, Power BI Pro is priced at $14 per user per month, up from $10, while Premium per user costs $24 per user per month, and organizations running large datasets, many users, or embedded analytics frequently find themselves requiring capacity-based Premium, which raises costs further.
For many organizations, the 1 GB limit is not an abstract concern. It is a daily operational reality that forces teams to choose between historical depth and analytical breadth, archiving older records, pre-aggregating fact tables, or splitting models in ways that fragment the logical data model and create consistency issues downstream.
The Refresh Frequency Constraint
The refresh frequency constraint is less visible but equally consequential. Power BI Pro allows up to eight scheduled refreshes per day, one roughly every three hours. Premium raises this to 48 refreshes per day, or one every 30 minutes at maximum. For operational teams making decisions on inventory positions, logistics exceptions, customer activity, or intraday financial exposure, that latency still matters. Power BI is not a real-time analytics platform. It can approximate real-time behavior through DirectQuery and streaming datasets, but both approaches introduce performance tradeoffs and engineering complexity that require deliberate architecture decisions, not just a license upgrade.
The Semantic Layer
The semantic layer is the third constraint, and arguably the most important one to understand. Power BI’s Analysis Services-based in-memory engine is fundamentally a consumption layer. It is built to query data that has already been prepared, cleaned, and loaded. It is not a transformation engine, a feature store, or an ML scoring platform. Asking it to behave like one produces overly complex DAX, expensive query plans, and semantic models that become increasingly fragile as logic accumulates.
The Real-Time Reality Check
The enterprise data landscape is changing in ways that put sustained pressure on batch-oriented architectures. According to IDC’s Global DataSphere research, the global rate of data creation and replication carried a compounded annual growth rate of 23 percent over the 2020–2025 period, and a meaningful share of that growth comes from event-driven systems: IoT sensors, transaction logs, clickstream data, and machine telemetry, all generating data whose value depreciates sharply within minutes of creation.
Power BI’s architecture assumes data arrives in batches. Even frequent refresh cycles create a structural gap between what is happening in the source system and what appears on a dashboard. For compliance monitoring, fraud detection, supply chain exception management, and real-time customer experience workflows, that gap has direct business consequences.
Organizations that genuinely need sub-15-minute latency should not be fighting Power BI’s refresh model. They should be introducing a streaming ingestion layer, Azure Event Hubs, Apache Kafka, or Microsoft Fabric’s Real-Time Intelligence, and using Power BI as the visualization surface on top of a properly constructed streaming pipeline. The mistake most organizations make is trying to solve a latency problem by upgrading their Power BI license. Licensing does not change the underlying data delivery architecture.
The ML/AI Integration Gap
Power BI includes some native machine learning functionality through its AutoML capabilities in Dataflows and basic cognitive service integrations. For straightforward classification or regression tasks on small, well-structured datasets, this can deliver value without leaving the Microsoft ecosystem.
However, Power BI’s AutoML is not a production ML platform. It does not support custom algorithm selection in the way data scientists require, it does not integrate natively with MLflow or model registries, and it does not scale to the compute demands of serious model training. When organizations need to embed predictions, anomaly-detection scores, propensity outputs, or NLP results into their operational dashboards, the model training and scoring logic must run elsewhere and then be surfaced through Power BI.
This is precisely where the integration architecture matters. Platforms such as Databricks ML or Azure Machine Learning handle the model lifecycle: training, versioning, deployment, and scoring. Scored outputs written to a Delta table, a SQL endpoint, or a staging dataset can then be consumed by Power BI via DirectQuery or scheduled import. According to MuleSoft’s 2025 Connectivity Benchmark Report, 95% of IT leaders report that integration challenges impede their AI implementation. The bottleneck is rarely the model itself. It is connecting the model’s outputs to the decision surfaces where they need to appear.
When Data Sprawl Becomes an Architecture Problem
One of the most common patterns we encounter at Paragon Shift is an organization that has grown its Power BI environment organically over several years, connecting individual reports directly to a mixture of ERP systems, CRMs, flat files, cloud applications, and department-maintained spreadsheets. Each report has its own direct connection to a source system. There is no shared, enforced definition of “active customer,” “gross margin,” or “on-time delivery” because there is no shared layer where those definitions would live.
This is not a Power BI problem. Power BI is doing what it was designed to do. The problem is the absence of a central data layer, a warehouse or lakehouse, that would provide a single source of truth, enforce consistent business logic, and decouple reports from the operational systems they draw from.
When the number of unintegrated source systems exceeds four or five, the ongoing cost of managing those direct connections, in terms of refresh failures, data inconsistencies, and maintenance overhead on individual report owners, typically exceeds the cost of building a proper data integration layer. At that point, adding more Power BI reports is accumulating technical debt, not adding analytical capability.
The architecture pattern is well-established: land raw data in a lakehouse (Azure Data Lake Storage, Microsoft Fabric OneLake, or Databricks), apply transformation logic in a structured medallion architecture (bronze → silver → gold), and expose the curated gold layer as the input to Power BI’s semantic models. This pattern reduces coupling between reports and operational systems, improves data quality and governance, and creates a foundation that supports not just BI but ML workloads, operational data products, and downstream automation. The global enterprise data management market was valued at $110.53 billion in 2024 and is projected to grow at a CAGR of 12.4% through 2030, a figure that reflects exactly this shift: organizations investing in the data infrastructure layer that sits below their visualization tools.
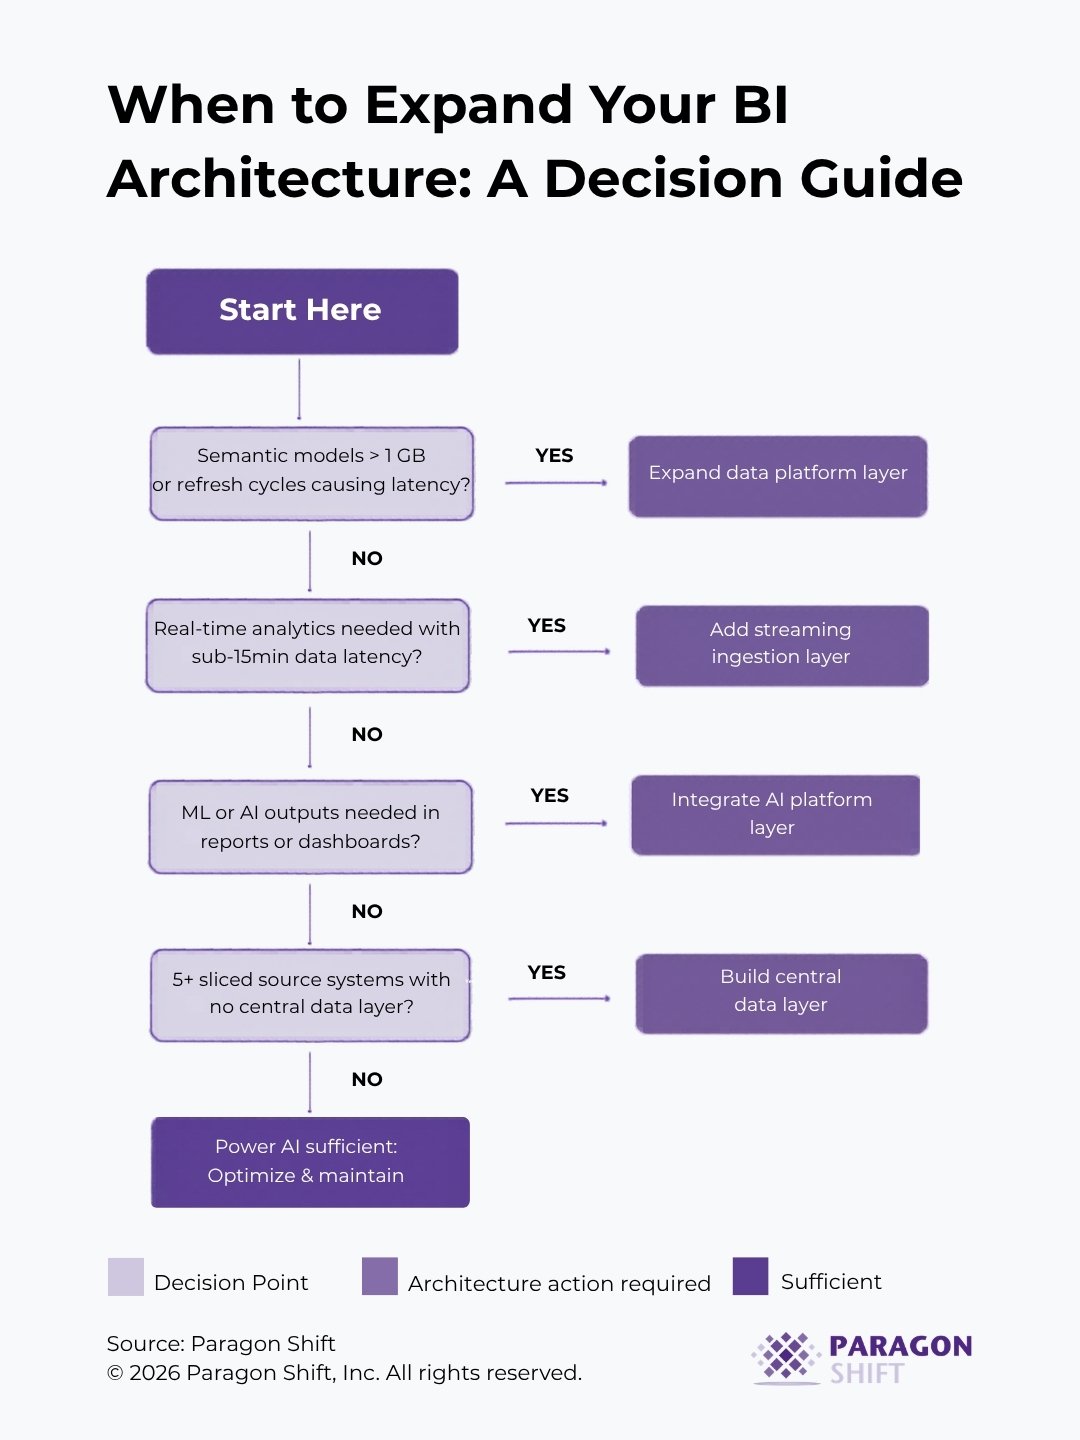
A Diagnostic Framework
The decision tree below is a practical diagnostic starting point and not a replacement for a proper architecture assessment, but a structured way to identify where your current environment is likely constrained.
Architecture Options Worth Understanding
If the diagnostic above suggests your architecture needs to expand, the platform options are not equivalent, and choosing the wrong one for your situation is an expensive mistake.
Microsoft Fabric
Microsoft Fabric is the most natural extension of a Power BI-centric environment. Fabric consolidates data engineering, warehousing, real-time analytics, and BI under a single, capacity-based licensing model. Its OneLake architecture, native integration with Power BI’s Direct Lake connectivity, and Copilot-native capabilities make it a strong choice for organizations already invested in the Microsoft ecosystem. The tradeoff is significant vendor concentration and a product that, while maturing rapidly, still has workloads that are earlier in their development than the equivalent offerings in competing platforms. Paragon Shift is a Microsoft partner with a Solutions Partner Designation for the Azure Data & AI badge, and we have direct implementation experience deploying Fabric and the broader Azure analytics stack across mid-market environments.
Azure Synapse Analytics
Azure Synapse Analytics is Microsoft’s established enterprise analytics platform. Mature, well-documented, and strong for SQL-based workloads and hybrid batch/streaming scenarios. Synapse integrates cleanly with Power BI and is appropriate for organizations that need enterprise-grade analytics infrastructure without committing fully to the Fabric model. It requires more configuration than Fabric but offers more flexibility in multi-cloud or hybrid-cloud environments.
Databricks
Databricks is the platform of choice for organizations with serious ML, data engineering, or multi-cloud requirements. The combination of Delta Lake, Unity Catalog, and MLflow provides a coherent data intelligence platform that scales from raw data ingestion through to production ML deployment. Paragon Shift is a Databricks technology partner with direct implementation experience across manufacturing, financial services, and retail environments. Databricks is not the lightest architectural addition, but for organizations where ML readiness and open-format data portability are priorities, it is the strongest foundation.
Qlik
Qlik is worth considering for organizations where the primary limitation is analytical flexibility rather than data engineering scale. Qlik’s associative engine handles complex multi-source joins and exploratory analysis in ways that Power BI’s filter context model was not designed to accommodate. Paragon Shift partners with Qlik and has deployed it in environments where Power BI’s report-centric design was a genuine constraint for advanced analytical exploration.
The right choice depends entirely on where your actual bottleneck is, not on which platform has the most active vendor marketing at the moment.
Key Takeaways
1. Dataset size and refresh frequency are symptoms, not root causes.
If your models are hitting limits or your dashboards feel perpetually stale, the question to ask is whether your upstream architecture, not your licensing tier, is the actual constraint.
2. Latency problems require pipeline solutions, not licensing upgrades.
Real-time analytics requires an event-driven ingestion layer. Power BI is the visualization surface; it is not the infrastructure that determines data freshness.
3. ML outputs belong in a model layer, not in DAX.
If your team is building increasingly complex calculated measures to approximate what a properly deployed ML model would produce, you are investing engineering effort in the wrong place.
4. More than four or five direct connections from Power BI to operational source systems is a structural signal.
It indicates the absence of a central data layer, a gap that compounds with every new report.
5. Platform selection should follow problem definition, not market momentum.
Microsoft Fabric, Synapse, Databricks, and Qlik solve meaningfully different problems. Understanding which bottleneck you are solving for is more important than following product announcements.
Conclusion
Power BI remains a strong, accessible tool for the majority of reporting use cases, provided the semantic models are well-designed, the source data is reasonably clean, and the refresh requirements are compatible with scheduled batch loads. The organizations that run into trouble are the ones that don’t revisit the architectural assumptions as their data requirements evolve.
A tool that was the right fit at 50 users and five data sources may not be the right fit at 500 users and 20 data sources. Knowing when to extend your architecture, and in which direction, is the difference between a BI program that scales with the business and one that generates technical debt faster than it generates insight.
Explore Related Services