
Automating Manual Reporting Processes:
A Practical Roadmap
Here is our perspective on automating manual reporting: most organizations are not struggling because they lack ambition, but because they started with the wrong reports, skipped the data foundation step,
or automated the format without fixing the process underneath. The roadmap that works is simpler than most programs suggest, and it starts well before any tool is selected.
Every month, in organizations across every industry, a version of the same sequence plays out. A deadline approaches. Someone pulls data from three systems that do not talk to each other. Someone else formats it into a spreadsheet built two years ago and has since been modified by six different people. A third person checks the numbers against last month’s version to see if anything looks off. A fourth person reformats the whole thing for the executive presentation. The process takes days. It is prone to error. And the moment it is finished, it is already out of date.
This is manual reporting. And it is not a minor inefficiency. Research by Unit4 found that professional services firms lose an average of 44 hours per week to manual finance processes, with 77 percent of surveyed decision-makers reporting that year-end financial discrepancies arise frequently, directly attributable to manual consolidation and disconnected systems.
A joint survey by the Association for Financial Professionals and APQC found that FP&A professionals spend only 25 percent of their time on value-added analysis. The remaining 75 percent is split between gathering data and administering processes. That ratio, three-quarters of a finance team’s capacity consumed by process rather than insight, is the clearest articulation of what manual reporting costs.
The good news is that this is solvable. The roadmap is not technically complex. But it requires a specific sequence, a clear-eyed assessment of what can and cannot be automated, and a governance discipline that most programs skip in their rush to deploy. This article covers all three.
What Manual Reporting Costs, Beyond the Obvious
The labor cost of manual reporting is the most visible part of the problem, but it is not the most significant. The more consequential cost is the decisions that get made on stale, incomplete, or inconsistent information because the reporting cycle could not move fast enough to reflect current conditions.
The operational reporting picture is equally constrained. A manufacturing plant whose production performance report requires a shift supervisor to manually extract data from the MES, compile it into a spreadsheet, and email it to operations management every morning is not operating with real-time visibility. It is operating on yesterday’s data, assembled by a person who could be doing something else.
A compliance team in a financial services firm that spends three weeks assembling the data required for a quarterly regulatory submission by pulling from trading systems, risk engines, and general ledger extracts is not just inefficient. It is exposed. Every manual step is a potential point of error in a submission that regulators will scrutinize. 61 percent of finance professionals say year-end reporting negatively impacts their team’s well-being, and 73 percent say a reduced year-end workload could help prevent burnout. Burnout and error rates are positively correlated. The human cost and the data quality cost are not separate problems.
Gartner’s November 2024 survey of 251 CFOs found that metrics, analytics, and reporting rank as the top operational focus area for finance leaders in 2025. The appetite for better reporting is at an all-time high. The gap between that appetite and what most teams can currently deliver is what this roadmap is designed to close.
What Can Be Automated, and What Cannot
This is the question most programs skip, and it is the one most responsible for implementations that disappoint. Not every report is automatable. Not every part of an automatable report is automatable to the same degree. Conflating the two produces programs that either try to automate too much and stall, or automate the wrong things and deliver no meaningful change to the people who matter.
Reports that are strong candidates for automation share four characteristics:
The underlying data is structured and sourced from systems
A weekly operational performance report that draws from an ERP, a manufacturing execution system, and a quality management database is automatable. A strategic narrative report that requires a finance director to synthesize qualitative observations about market dynamics is not. The test is whether a defined, repeatable extraction process can reliably produce the input data.
The report runs on a defined schedule with a consistent structure
A monthly P&L variance report with a fixed format and a defined distribution list is automatable. An ad hoc analysis that a CFO requests in a different format every time is not a candidate for reporting automation. It is an analytical request that requires human judgment at the design stage.
The logic that transforms raw data into the report’s content is documented and stable
This is where most programs encounter their first surprise. Reports that appear straightforward often contain transformation logic, such as calculations, aggregations, exception rules, period-over-period comparisons, that exists only in the spreadsheet or in the institutional knowledge of the person who built it. Until that logic is documented, it cannot be reliably automated.
The output format is consistent, and its audience is defined
A report that goes to the same distribution list in the same format every cycle is automatable. A report that is reformatted differently for different audiences, or whose structure changes based on the news it contains, requires human judgment in the output stage.
Industries where these conditions are most commonly met include financial services (regulatory reporting, risk reporting, treasury), manufacturing (OEE dashboards, production variance, quality KPIs), healthcare (clinical operations reporting, billing reconciliation), retail (daily sales and inventory positions), and logistics (delivery performance, fleet utilization).
100 percent of FP&A professionals use spreadsheets for planning and reporting at least quarterly, and 93 percent use them for financial reporting on a daily or weekly basis. The spreadsheet is the symptom, not the cause. The cause is the absence of a governed data layer that would make spreadsheet-based assembly unnecessary. Automating the spreadsheet without addressing the data layer replicates the problem in a different format.
The Four Stages of the Roadmap
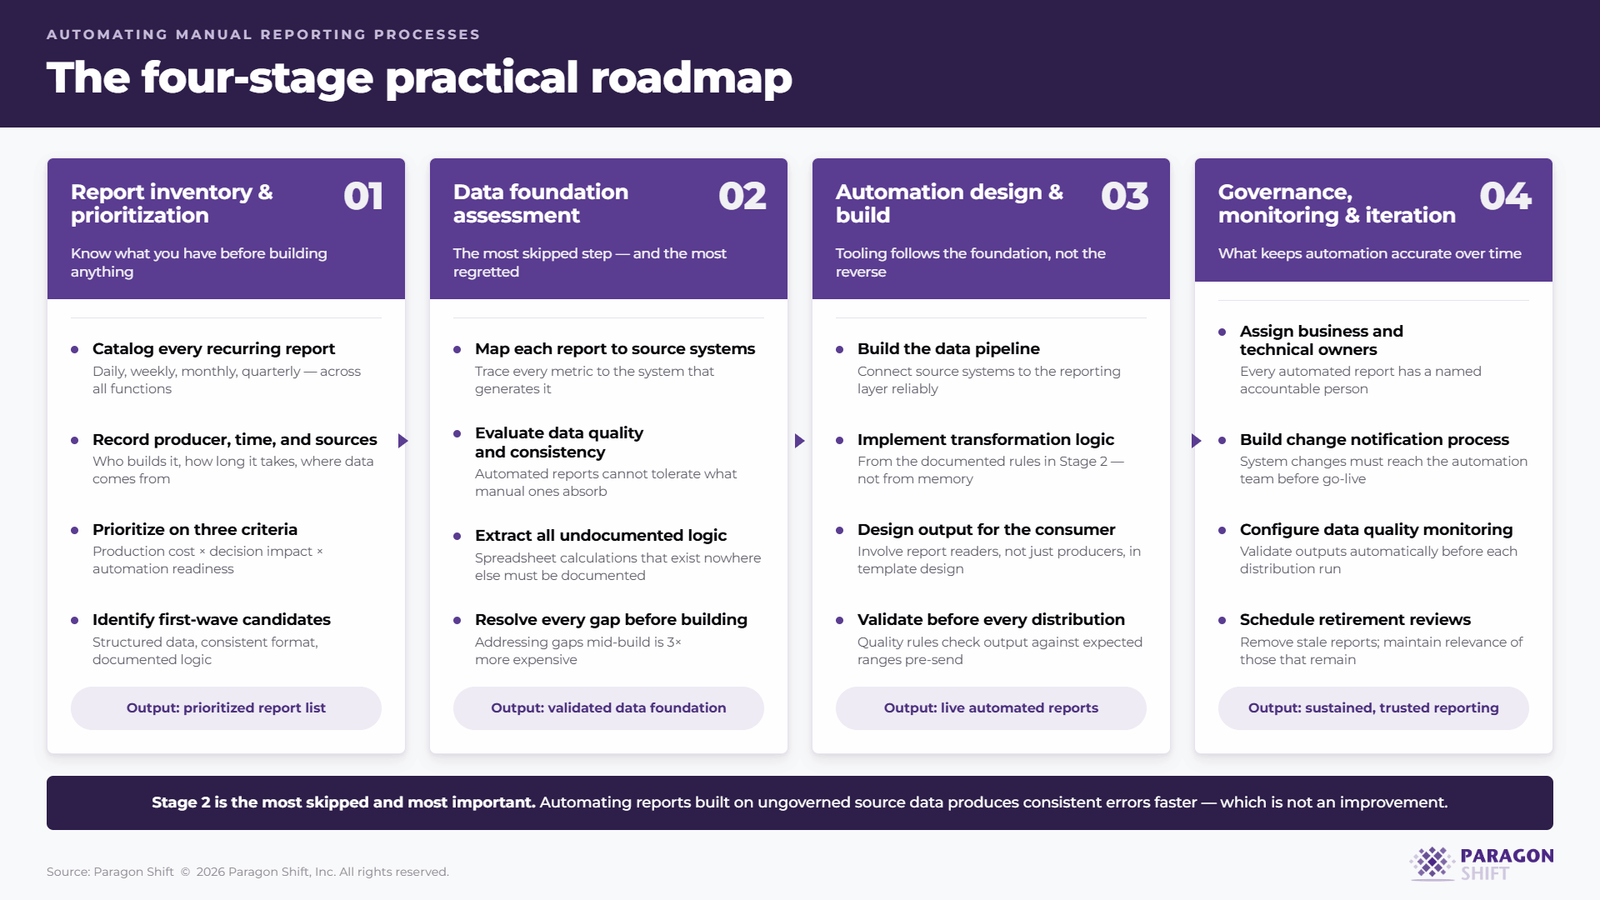
Stage 1: Report Inventory and Prioritization
Before any tool is selected or any pipeline is built, the program needs a complete inventory of what exists. This means cataloging every recurring report the organization produces on a daily, weekly, monthly, and quarterly basis with the following information for each: who produces it, how long it takes, where the source data comes from, how many recipients it has, and what decisions it informs.
This exercise consistently surfaces surprises. Most organizations discover they are producing significantly more recurring reports than anyone realized, that a meaningful portion of those reports have very few readers, and that the reports consuming the most production effort are often not the most strategically important ones.
Prioritize automation candidates using three criteria: production cost (time × labor rate), decision impact (how important is the report to the business), and automation readiness (how well do the four characteristics above apply). The reports that rank high on all three are the first-wave candidates. The reports that rank high on cost and impact but low on readiness are the second-wave candidates, after the data foundation work in Stage 2 has been completed.
A retailer automating its reporting environment might discover that its daily inventory position report, produced every morning by a single analyst pulling from four separate systems, ranks highest on all three criteria. It consumes significant labor, informs procurement and replenishment decisions that affect margin, and data sources are structured and consistent. That is a first-wave candidate. The monthly strategic review pack that requires the CFO’s qualitative commentary on market conditions is not a candidate for automation at all.
Stage 2: Data Foundation Assessment and Remediation
This is the stage that most programs skip, and most programs regret skipping. Every automated report is only as reliable as the data feeding it. A report that was previously assembled manually could tolerate inconsistencies in the source data because the human assembling it could catch and correct them. An automated report cannot. It will faithfully reflect whatever the source data contains, including the errors.
75 percent of finance managers say their close processes do not work well because of manual workflows and disconnected systems. Disconnected systems are a data foundation problem, not a reporting technology problem. The automated reporting layer sits above the data foundation. Until the foundation is addressed, the reporting layer will produce fast, consistent, wrong numbers rather than slow, inconsistent, wrong numbers. That is not an improvement.
The data foundation assessment maps each first-wave report to its source systems, evaluates the quality and consistency of the data each system produces, identifies the transformation logic that converts raw data into report-ready metrics, and determines whether that logic is documented, stable, and defensible. Any gaps surfaced in this assessment are addressed before automation begins, and not during it.
At Paragon Shift, this assessment is always the first phase of a reporting automation engagement. The finding that most consistently delays programs is undocumented transformation logic in legacy spreadsheets, calculations that have been in place for years but exist nowhere except in a file on a single analyst’s laptop. Extracting, documenting, and governing that logic before automating the report that depends on it is the step that determines whether the automation will be trusted by the people who receive it.
Stage 3: Automation Design and Build
With a prioritized report list and a validated data foundation, the automation design phase produces three things: the data pipeline that connects source systems to the reporting layer, the transformation logic that converts extracted data into report-ready metrics, and the output template that formats and distributes the finished report.
The technology choices at this stage are determined by the organization’s existing data infrastructure, not by vendor preference. An organization already running a Microsoft ecosystem, Azure, Power BI, and Fabric, has a natural path to automated reporting through Power BI scheduled refresh, Direct Lake connectivity, and Power Automate distribution workflows. An organization with a Databricks data platform can automate reporting against a governed gold layer of curated, analytics-ready data with Power BI or another consumption tool on top.
The tooling is not the hard part. The hard part is the transformation logic, which should now be documented from Stage 2, and the output template design. The template design question is the one most often resolved incorrectly: organizations automate the existing report format rather than designing a format suited to automated delivery. A report assembled manually over two days often contains explanatory text, footnotes, and contextual annotations that a human added during assembly. An automated report without those annotations is not a substitute; it is raw data in a formatted container. The template design phase should involve the report’s primary consumers, not just its producers, to ensure the automated output delivers the information they need.
A healthcare system automating its weekly clinical operations dashboard needs to involve department heads in the template design, not just the analysts who currently produce it. The analysts know what data is available. The department heads know what information they use to make staffing and resource decisions. Bridging those two perspectives produces a dashboard that is genuinely decision-useful rather than technically complete.
Stage 4: Governance, Monitoring, and Iteration
An automated report is not a delivered artifact; it is a running system that requires governance to remain accurate and trusted over time. This stage is where most programs underinvest, and where the value of the investment is lost when the data changes, the source systems evolve, or the business rules that underpin the report are revised.
Governance for automated reporting has four components.
Ownership assignment. Every automated report needs a named business owner who is accountable for its accuracy and relevance, and a technical owner responsible for the pipeline and transformation logic. When the report produces an unexpected result, both owners need to be identifiable and reachable.
Source system change management. When a system that feeds an automated report is updated, a schema change, a field renaming, or a new data category is made, the automation team needs to know before the change is deployed. Without a formal notification process, system changes surface as unexplained anomalies in report outputs, often days after the change has already propagated through the pipeline.
Data quality monitoring. Automated reports should include validation rules that check the output against expected ranges before distribution. A daily sales report that is automatically distributed before anyone has verified that the underlying data loaded correctly is not more reliable than the manual version; it is less reliable because it is more likely to reach the wrong audience before anyone notices the problem.
Retirement and review process. Reports accumulate. A report that was valuable two years ago may no longer serve its original purpose, or may have been superseded by a more capable successor. A periodic review of the automated report portfolio, at least annually, ensures that the infrastructure is not maintaining outputs no one uses and confirms accountability for those that remain.
At Paragon Shift, the governance framework for automated reporting is designed in parallel with the automation build. The engagements of automated reports maintain their accuracy and continue to be trusted twelve months after deployment are consistently those where ownership was assigned, change notification was built into the process, and the retirement review was scheduled before the first report went live.
What Good Looks Like: Examples Across Industries
Financial Services — Regulatory Reporting:
A regional bank automates its monthly regulatory capital adequacy report, previously assembled over three weeks by a team of four analysts pulling from trading systems, risk engines, and the general ledger. The automated pipeline extracts data daily, applies documented calculation logic, validates output against tolerance ranges, and produces a structured submission-ready report within four hours of the monthly data freeze. The team’s time shifts from assembly to validation and interpretation. Automated consolidation reduces month-end close by up to 70 percent, with complete audit trails and real-time visibility replacing the manual stitch-and-check cycle.
Manufacturing — Operational Performance:
A discrete manufacturer automates its daily OEE dashboard for six production lines, previously assembled each morning by shift supervisors, exporting data from the MES and formatting it manually. The automated pipeline pulls from the historian and MES in real time, applies the OEE calculation logic documented during the Stage 2 assessment, and pushes a formatted dashboard to operations management by 6:00 AM. Shift supervisors no longer spend the first 45 minutes of their day on data assembly. They spend it on the exceptions the dashboard has already identified.
Healthcare — Clinical Operations:
A hospital network automates its weekly staffing utilization report, previously compiled by department administrators from six nursing unit systems. The automation connects to the scheduling and patient flow systems, applies occupancy and utilization logic, and distributes a formatted summary to department heads and the COO every Monday morning. The reporting cycle that previously took two days now completes overnight. The information is more current, and the format has been redesigned based on what department heads said they use to make staffing decisions.
Retail — Inventory and Sales:
A specialty retailer automates its daily inventory position report across 120 SKUs and 18 store locations, previously assembled by a single analyst from three system exports every morning. The automated pipeline connects to the POS system, the warehouse management system, and the reorder system, and produces a formatted inventory health report that automatically flags at-risk SKUs. The analyst whose time was consumed by assembly now runs the analysis that the report was always supposed to enable.
Key Takeaways
1. FP&A professionals spend only 25 percent of their time on value-added analysis; the remaining 75 percent goes to data gathering and process administration. Reporting automation’s primary value is not producing reports faster. It is returning the time currently consumed by manual assembly to analysis and decision support.
2. Not every report is automatable. The four qualifying characteristics, structured source data, consistent schedule and structure, documented transformation logic, and defined output format, determine whether a report belongs in the first wave, the second wave, or outside the scope entirely.
3. The data foundation assessment is the most important phase of the roadmap and the most consistently skipped. Automating a report built on ungoverned source data produces consistent errors faster, which is not an improvement.
4. 75 percent of finance managers say their close processes do not work well because of manual workflows and disconnected systems. The disconnected systems are the root problem. Reporting automation that does not address the data integration layer will underperform against expectations.
5. Template design must involve the report’s consumers, not just its producers. An automated report that reproduces the format of a manually assembled report without considering what the consumers need is a technology deployment, not a reporting improvement.
6. Governance, ownership assignment, change notification, quality monitoring, and retirement process, determine whether automated reports maintain their accuracy and trust over time. Programs that defer governance consistently lose both.
Conclusion
The organizations that have closed the gap between the reporting their teams produce and the reporting their leadership needs did not get there by selecting the right tool. They got there by doing the sequence correctly: inventorying what exists, assessing the data foundation, designing for the consumer rather than the producer, and governing the result with enough discipline that it remains accurate as the underlying systems evolve.
Manual reporting is not a problem that resolves itself with time. It compounds. Each additional system, each additional reporting cycle, each additional manual handoff adds to the overhead and risk. The programs that address it systematically, even starting with a single high-value report, consistently find that the first automation builds the organizational confidence and the technical foundation for the second, and that the returns compound from there.